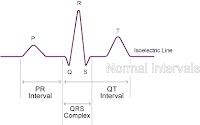
Now that we have the basics out of the way, let's take a moment and review.
EKGs can tell us a lot about a patient. An EKG should be done on every patient that complains of chest. Knowing how to interpret them may save someone's life. For every P wave there should be a QRS followed by a T wave. Knowing what the PR interval, ST segment and QT interval are can tell us whether the rhythm is normal, there is injury or ischemia, or if there may be medication affecting the rhythm.
Tomorrow we will begin to look at normal sinus rhythms, sinus brady, and what asystole and look at some atrial arrhythmias. Please feel free to review the videos to stay up on what we have just learned. Any questions, feel free to ask Marna.
Sunday, March 4, 2012
Saturday, March 3, 2012
How do they measure?
 Ekg rhythm's have a certain measurement for every PR interval, QRS width, ST segment and the QT interval on Ekg paper. The PR interval typically measures 0.12 to 0.2 seconds, QRS typically measures 0.06 to 0.1 seconds, ST segment if elevated 1mm or greater is ST elevation and means there is active injury taking place. If there is ST depression there is ischemia that has occurred. QT interval measures the time it takes for the ventricles to depolarize an repolarize to the ventricular repolarization. For more information on this topic please see: http://geekymedics.com/body-systems/cardiology/understanding-an-ecg/.
 This Ekg grip can show the rhythm strip paper and what each box measures. One small box measures 0.04 seconds. There are 5 small boxes measuring 0.04 in one large box. 0.04 x 5= 0.2 seconds. When looking at rhythms and measuring them these boxes are an important component of measurements and rhythm rate. Please review this grid and see the example rhythm strips below. Can you identify the PR interval, QRS width, ST segment and is it ST elevation or ST depression and the QT interval? If you have any questions feel free to ask Marna.
Thursday, March 1, 2012
Putting it all together
Can you identify the PQRST, PR, QT, and ST parts of this EKG? What do the lines on the paper help determine? Does anybody have any experience in reading EKGs? If you do, what is this rhythm? How do you know? What identifying features does this rhythm have? We will discuss the large and small blocks on the paper and what they represent the next time we meet.
Tuesday, February 28, 2012
PR, ST, QT
 |
The ST segment measures the time from the end of ventricular depolarization to the start of ventricular repolarization. The ST segment is the straight line connecting the end of the QRS complex with the beginning of the T wave.
The QT interval measures the time from the beginning of ventricular depolarization to the end of ventricular repolarization. The QT interval includes the QRS complex, the ST segment, and the Twave.
Why are these intervals and segments important? Please take time to review some of the videos provided in the blog header to understand these important elements of an EKG. Please review the following site for more info.
http://www.nottingham.ac.uk/nursing/practice/resources/cardiology/function/normal_duration.php
Monday, February 27, 2012
PQRST an electrical event
An EKG is an electrical waveform recording that records each cardiac cycle of contraction (systole) and relaxation (diastole). These electrical events are what produce the basic waves and lines of the standard EKG. Please see below. The P wave is produced by atrial contraction or depolarization represented by the upward curve of the image below. The QRS is produced by ventricular contraction or depolarization which is represented by the next wave which may have several variations. This electrical waveform begins with a downward deflection or the Q wave, the next and first upward deflection or the R wave, and the next downward deflection after the upward deflection is called the S wave. The T wave is the electrical representation of the ventricles end of depolarization and the start of ventricular repolarization or relaxation.
Notice in the EKG strip on the right the locations of the PQRST. For more information on the background of the PQRST and their meaning on the EKG please read http://www.edinformatics.com/inventions_inventors/electrocardiogram.htm
Notice in the EKG strip on the right the locations of the PQRST. For more information on the background of the PQRST and their meaning on the EKG please read http://www.edinformatics.com/inventions_inventors/electrocardiogram.htm
Sunday, February 26, 2012
EKG: A tool with remarkable clinical power
- An EKG reading can diagnose an evolving heart attack, identify life threatening arrhythmias, effects of a pulmonary embolus or blood clot in the lungs, or just a normal heart that functions and beat properly.
- Come learn with me how to read EKGs. They are easy to read, fun to interpret and can carry BIG meaning behind their readings.
- Do you know the heart gives off electricity and what that electricity helps with?
- Do you know what the letters PQRST mean?
- Come learn with me how to read EKGs. They are easy to read, fun to interpret and can carry BIG meaning behind their readings.
- Do you know the heart gives off electricity and what that electricity helps with?
- Do you know what the letters PQRST mean?
Subscribe to:
Posts (Atom)


